The history of data visualization
We think of data visualization as a relatively modern term. But graphically portraying information has its own history of origins and development. It began first as map-making, then visual depictions of stories and so on. Today data visualization has many applications. We cannot imagine the world without visualizing data. We use data visualization as a connecting bridge to many professional areas.
Traditionally data has been presented in a textual form. This lasted until the 19th century. From that point, a variety of advancements contributed to the widespread use of data visualization today. These include technologies for drawing and reproducing images, advances in mathematics and statistics, and new developments in data collection, empirical observation and recording.
Early maps and diagrams (Pre-17th Century):
One of the earliest seeds of data visualization was diagrams. They were used to label the position of celestial bodies such as stars. The diagrams were then evolved into a more complex, and detailed labeling. People started to use these evolved diagrams to navigate and explore lands and places. These diagrams were called maps. The first idea of maps and coordinates was used by the ancient Egyptians. Egyptian surveyors used maps to lay out towns. They used earthly and heavenly positions were located by something similar to today’s latitude and longitude.
1600-1699:
Then, in the 1660s, began the systematic collection of social data. The data was gathered and studied. Many European countries began using the political arithmetic to inform the started about political matters such as wealth, agricultural land, population and taxes. They also used life tables as a source to sell and commercialize products and purposes.
As you can see, this century was the time when visual representation of collected data started rising. It used all the previously gotten evidence and elements, developed them and made sense of them.
18th Century: 1700-1799
The idea of how important visual representation is was established in the beginning of the 18th century. New graphic forms and domains started to expand.
For example, in cartography maps became more detailed. By the end of the century, maps were used to map economic, geologic and medical data. The fist statistical theory was introduced. As empirical data was being collected, new ways of representing it were crucial to showcase its accuracy.
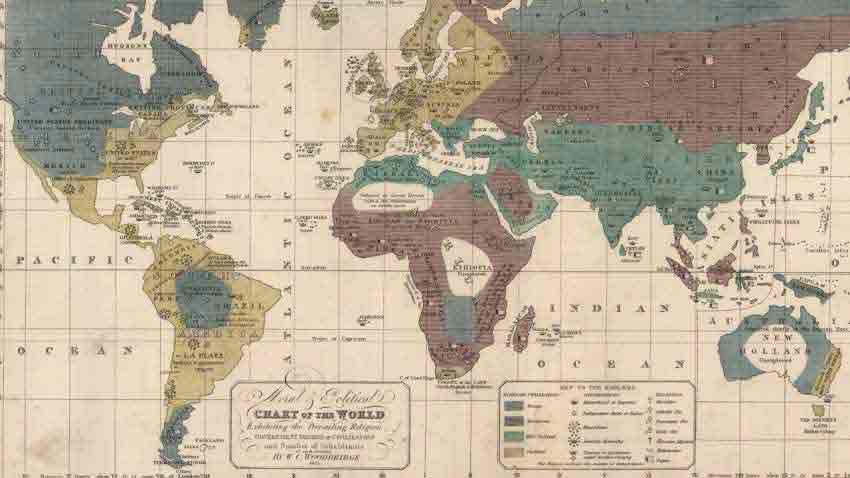
19th Century: The era of modern graphics
With the fertilization provided by the previous innovations of design and technique, the first half of the 19th century witnessed explosive growth in statistical graphics and thematic mapping, at a rate which would not be equaled until modern times.
Bar, pie charts, histograms and line charts were used as a way to present enormous amount of data for variety of topics. This includes medical topics, political, socio-economic, moral, and physical and so much more)
Data visualization in the 20th and 21st Century
As technology began to rise, and the digitalization and computerization of the world started, the need of data visualization skyrocketed. Everything became technology-dependant. And, simultaneously enormous amounts of data started to flood the digital systems.
Traditionally, in the early 80s and 90s, data was presented in tables and excel charts. This data took a lot of time to collect, sort and analyze. The information had to be run through and then studied. This was all done by specialized in data analysis.
However, during the last decade, many other technologies were put on the market that eased the job. Machine learning and AI began to take over the jobs of many people. Now, data could come in from all kinds of sources. It didn’t have to be organized, as those machines are programmed to sort it.
From this history one may also see that most of the innovations in data visualization arose from concrete, often practical goals: the need or desire to see phenomena and relationships in new or different ways. It is also clear that the development of graphic methods depended fundamentally on parallel advances in technology, data collection and statistical theory