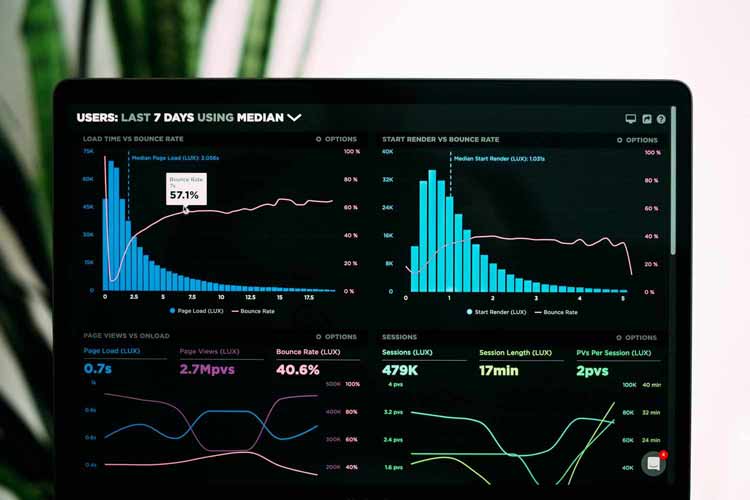
The Data Visualization Markets
In the past decade, the amount of data generated by the IoT is enormous. Because of its large scale, data visualization aids to pin down the relationship between the multidimensional data sets. It issues empirical characteristics and features and elucidates them.
 Read more...
Data Visualization Techniques
Data visualization is an essential component of an excellent business strategy.
 Read more...
Data Visualization Terminology
Data visualization is closely connected with statistics. That is why similar terms and terminology are involved and used. Data visualization derives from data science.
 Read more...
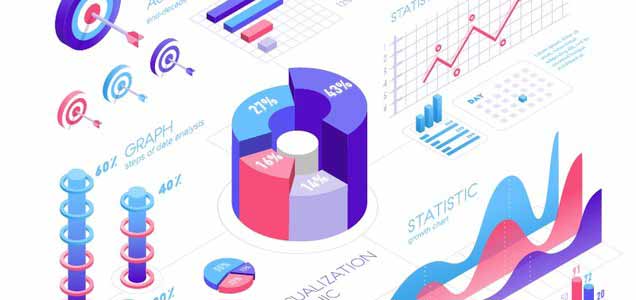
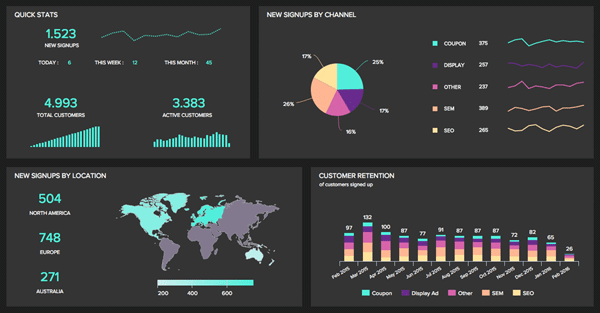
Data visualization tools
To represent large data sets, designers use special data visualization tools. It is an easier way to deal with hundreds and thousands of data points. Read more...
The Future of Data Visualization
It is a known fact that how data is visualized has evolved over the last ten years or so. Many companies, organizations and industries have sophisticated tools and softwares to present the enormous amounts of data they have been collecting.
 Read more...
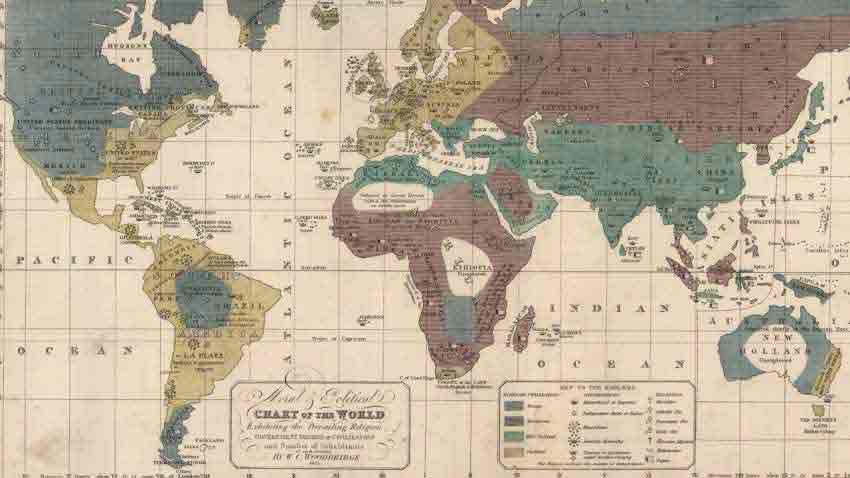
The history of data visualization
We think of data visualization as a relatively modern term. But graphically portraying information has its own history of origins and development.
 Read more...
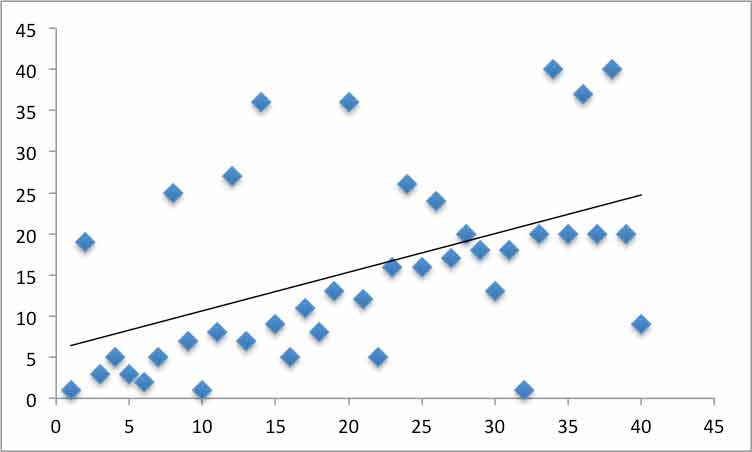
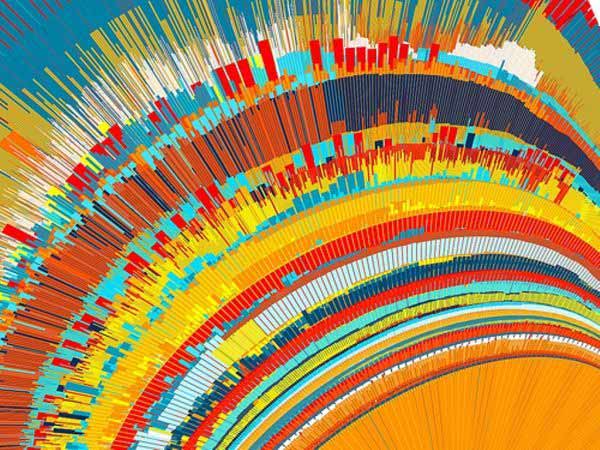
The science of data visualization
When we think of data visualization, we think of the process of presenting data in a simple, yet visually attractive way. To successfully show data, you have to create images that talk and communicate relationships between the data and the viewers. This can be achieved by using a systematic mapping.
 Read more...
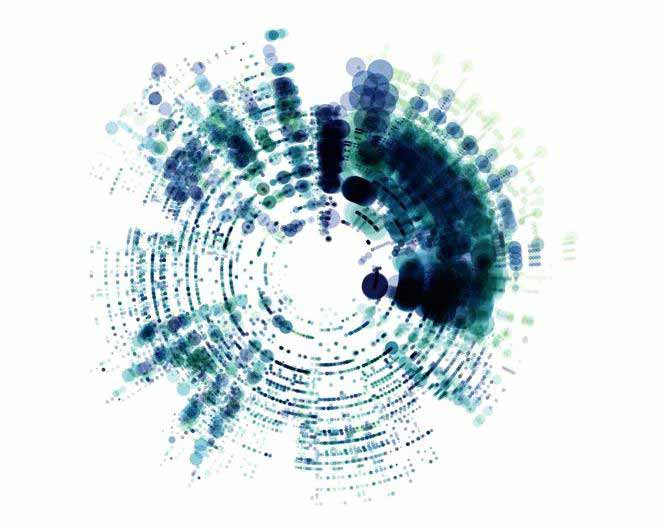
What is Data Visualization
Data visualization is the technique to present data in a more visual and broad format. It enables business owners, stakeholders and decision-makers to visually analyze information. When they study the graphs, charts and bars, they identify new patterns and trends more easily
 Read more...