What is Data Visualization
Definition
Data visualization is the technique to present data in a more visual and broad format. It enables business owners, stakeholders and decision-makers to visually analyze information. When they study the graphs, charts and bars, they identify new patterns and trends more easily.
Types of data visualization
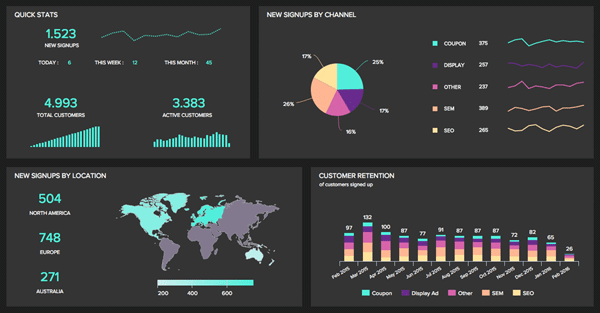
There are various ways you can present data. Although charts and graphs are most used, they are not the only types. There is a whole spectrum of ways and methods you can use to show data. They are equally effective. Not to mention, they are attractive and interesting to look at.
• Bars
• Lines
• Bullet charts
• Areas
• Maps
• Tables
• Pie charts
• Bubble cloud
• Dot distribution map
Why is data visualization important?
This practice helps you a fast way to communicate complex information. It presents it in a simple way so that it is universally understood. Many big industries depend on data visualization. Every organization needs to understand data in order to survive in the digital world.
For instance, it aids businesses better understand and identify the consumer market. It guides them towards better understanding of which factors impact the consumer behavior. It also pinpoints areas that could be improved. It also highlights important areas of information. For stakeholders, it makes the received data more memorable – it guides them to know when and where to put goods and products. Not only that, but to predict sales and sale volumes as well.
The advantages of data visualization
Data visualization doesn’t end there. It comes with much more advantages than it seems. Here are some real-life applications of data visualization:
• Politics
Data visualization is used in politics to display the political parties. When there is an election, it shows a geographical map of each state. It shows which district or state has voted for which party based on given data.
• Finance
Many finance professionals have to pay attention to their investment decisions. Whether they’re buying or selling some financial asset, it is crucial to analyze movements. For this type of sector, the best type of data visualization method is candlestick charts. These charts offer an extensive insight into how prices move, how important data is presented. You can also track currencies and stock value. When you analyze how all of these things work with one another, you won’t have trouble detecting trends.
• Marketing
Data visualization has an enormous impact in the marketing world. If you are a business owner, you can use data visualization to see how your website performs. For example, you are able to see what pages on your site convert the most traffic and drive conversions. It allows you to have a full view of how the digital traffic varies throughout the day.
The data presented also tells you the demographic of your customers, their buying habits, likes and dislikes of a product, where they come from and so much more.
With this given information, you are able to sell products more efficiently. It will be also easier for you to reach to your targeted audience and to analyze what their needs are. That way you will be able to come up with a solution to their problems.
How is data visualization connected to big data?
In recent years, big data exploded in popularity. Because it has become bigger than ever, it is now important to present it in a way that is understandable to everyone. Companies all over the world use machine learning to gather enormous amounts of data. That data can be hard to sort out, understand and explained. Here, data visualization comes into play. It speeds up the process of sorting information.
It also shows and presents that collected information to the people in charge. This simple showcasing of data is crucial, as many company owners do not specialize in data analytics. So, the way that complex data is offered has to be simplified.
Data is integral to success. It doesn’t matter if it is used to customize advertisements, or to stream goods and a service to millions of people, data is necessary. But, in many cases, people don’t know how to read or sort it. That is why it is important to have the collected information served in a chewed way. Your main goal is to understand how to use the received data from the external world. And, to do need to present data the right way. Data visualization is a powerful tool in many businesses. If you learn to use it, you are guaranteed to succeed in a world of rising competition.