AI ML learning: Will Ai Take Over Humans?
Will artificial intelligence at some point in the future exceed human thinking and even rule humans? If you are a tech geek or technology is among your interests, then you must have thought about this question or asked yourself how it will turn out to be in the future. Read more...
AI ML learning: Is AI The Future?
Did you know that back then in 2018, AI oracle and venture capitalist – Dr. Kai-Fu Lee said that AI is going to change the world more than anything in the history of mankind, more than electricity? That utterance carries so much weight. Imagine something that changes the world more as compared to whatever tech we’ve seen until today!
 Read more...
AI ML learning: The Challenges of Artificial Intelligence
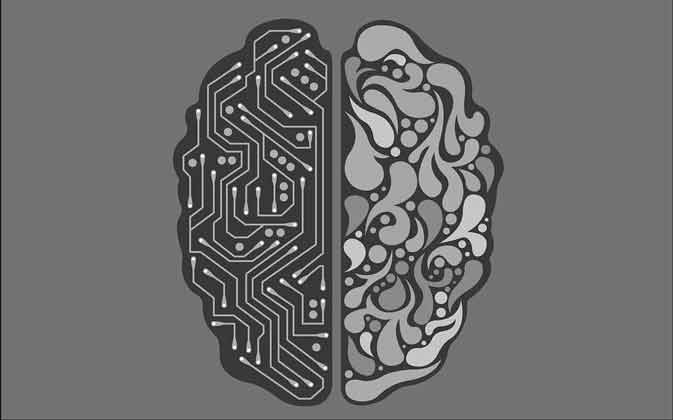
Is it astonishing how Artificial Intelligence has impacted our world - our daily lives even. It has become so incorporated in many aspects that it is no longer an alienated term. It is a technology that changes the world. Although it offers numerous benefits, it still comes with many obstacles
 Read more...
AI ML learning: The Ethics of Artificial Intelligence (AI)
We can define Artificial Intelligence (AI) as a subset of computer science. Its main goal is to copy human behavior and intelligence in a machine or a device. That way they will be able to do tasks that generally can be only performed by humans. One of the things AI systems are programmed to do is learning, planning, problem solving, reasoning and decision-making. Read more...
AI ML learning: What Is Deep Learning And How Is It Connected To AI?
In recent years, Deep Learning has become a term that occupied the branch of Machine Learning. It imitates the human brain as to how to process data and to create patterns that can be used for making decisions. It is a system based on artificial neural networks with representation learning. Read more...
Statistics: Conditional Probability
Based on a previous event or outcome, the conditionality probability is characterized as the probability of an event or product. Conditional probability shall be compared with the modified chance of the successor or dependent circumstance by multiplying the previous event's possibility. Read more...
Statistics: Descriptive vs. Inferential Statistics
If we want to use descriptive statistics, it's indeed useful to use a combination of management process (i.e. tables), reported that the results (i.e. graphs and charts) and statistical commentary to summarize our data group (i.e., a discussion of the results). Read more...
Statistics: Hypothesis Testing
The most popular framework for statistical hypothesis testing is meaning-based hypothesis testing. An alternate method for the analysis of statistical hypotheses is to define a collection of statistical models, from each candidate hypothesis, and then select the most appropriate framework using model selection techniques. The most popular methods of selection are based either on the criterion for Akaike knowledge or the Bayes factor. Read more...
Statistics: Joint Probability Distribution
In statistics, any statistical association, whether causal or not, among both two or more variables or bivariate data is correlation or dependency. Any statistical correlation is correlated in the broadest sense, although it typically refers to the degree to which a pair of variables are connected linearly. Familiar examples of dependent phenomena include the correlation between the height of parents and their children, as seen in the so-called demand curve, and the correlation between the price of a good and the amount buyers are willing to buy. Read more...
Statistics: Kurtosis
In finance and, more precisely, risk management, excess kurtosis is a required method. Any occurrence in question is vulnerable to extreme effects with severe kurtosis. When analyzing historical returns from a single stock or portfolio, it is a significant factor. Read more...
Statistics: Regression Analysis
In statistical modeling, regression analytics are used statistically to measure the relationship between dependent variables and one or more independent (often known as 'predictors',' covariates' or 'features') variables. Linear regression is the most common method of regression analysis where a researcher looks for a line (or more complex linear combination) that closely matches the data according to specific criteria. Read more...
Statistics: P-value in Statistics
In statistics, if the null hypothesis is right, the p-value is the likelihood of achieving outcomes at least as extreme as the measured data of a statistical hypothesis test. The p-value can be used to offer the smallest level of significance at which the null hypothesis will be denied, as an equivalent to rejection points. A lower p-value means the proof in favor of the alternative hypothesis is greater.

Statistics: Standard Deviation
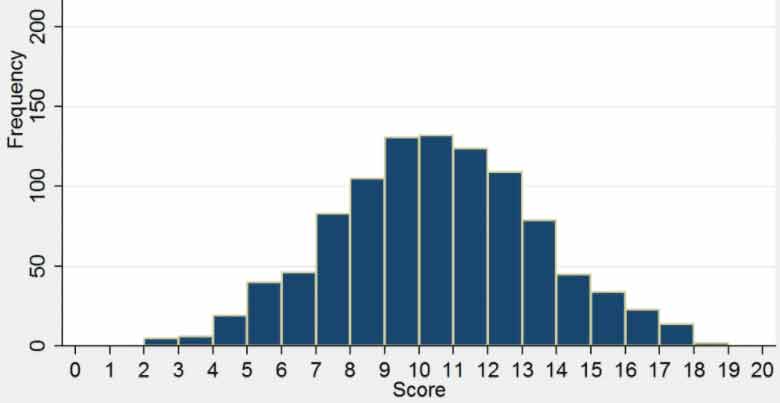
The standard deviation is the calculation of the dispersion of a dataset relative to the average and is the square root of the variance measured. The standard deviation is calculated as a radical quadratic variance by evaluating the difference between each data point and the mean. If the data points are longer than average, the greater the disparity within the dataset. Thus, the more the data are distributed, the higher the norm.
 Read more...
Statistics: What is Statistics?
Statistics is the process of gathering, organizing, presenting, analyzing, and interpreting data. This is done in order for the data to be used for making more sound decisions. This whole discipline of statistics is the fundament of many current and future businesses.
Statistics: Z-score and Probability
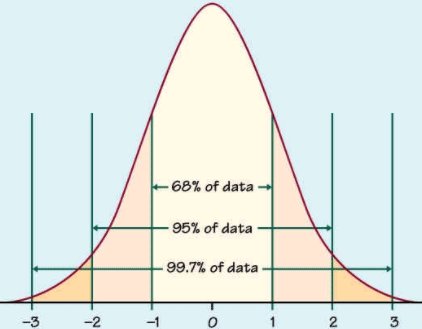
Strictly speaking, a z-score (almost always named a regular score) represents the fundamental building block of just how far a piece of data would be from the average. But more theoretically, it's a calculation of how many normal deviations mean a raw score is below or above the population.
Statistics: Combinatorics
Combinatorics is a field of mathematics that mainly focuses on numbers as a way to generate results, as well as specific properties of finite structures. It is closely connected to many other fields, from logic to mathematical mechanics, from evolutionary biology to computer science, and so on.
 Read more...
Statistics: How is ANOVA used in Statistics
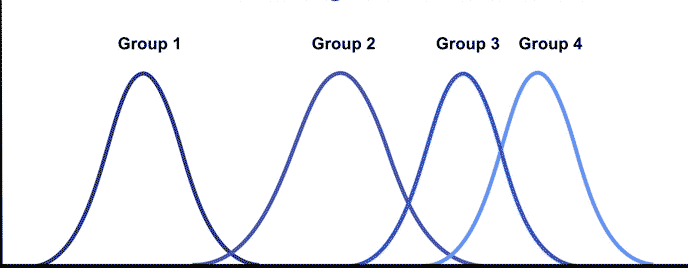
Analysis of Variance (ANOVA) is a statistical analysis technique that divides the observed aggregate variability within a data set into two components: systematic and random factors.
AI ML learning: What is Artificial Intelligence
Artificial Intelligence has rapidly walked into our world. It revolutionized every aspect of daily life. Read more...
AI ML learning: Applications of Deep Learning across Industries
We would have never imagined that technology would become this advanced. From self-driving cars to virtual assistants, the world is almost dependant of them. They are an unavoidable part of our everyday life. The advancement of AI has been the result of the improvement of Deep Learning. But, when we think of deep learning we often don’t think about how directly and indirectly applies to our life. Read more...
Big Data: The future of Big Data
Big Data has exponentially grown over the past few decades. As technology is constantly evolving, and doesn’t seem to stop, the question lies in how far they will go. The whole world runs on Big Data. This drastic shift has forced companies to look for experts that will help them with big data. They will be able to consult them and harness complex data processing. Read more...
Big Data: Problems with Big Data
Although Big Data has made its impact on industries across the globe, various problems have arisen on the surface. Like many other data-related things, issues cannot be escaped. However, here these problems are rather serious and concerning.
 Read more...
Big Data: Hadoop Big Data
Hadoop is an open-source platform for managing distributed storage and processing of enormous sets of data. It is software that runs on clusters of computers instead of just one PC. Distributed storage is one of the most important things Hadoop provides.
 Read more...
Big Data: Characteristics of Big Data
When it comes to managing and organizing data, a lot of traditional data systems have been the first and only way to do so. Even though there are a lot of storage houses and technologies exist, most of the data is found in the traditional storage systems. These types of traditional systems were firstly designed to work with data that is also known as structured data.
 Read more...
Big Data: Big Data & Traditional Data Systems
When it comes to managing and organizing data, a lot of traditional data systems have been the first and only way to do so. Even though there are a lot of storage houses and technologies exist, most of the data is found in the traditional storage systems. These types of traditional systems were firstly designed to work with data that is also known as structured data.
 Read more...
Big Data: Big Data Ecosystems
The collection of systems, analytics and applications that is utilized for capturing and analyzing data is known as a Big Data ecosystem. These data ecosystems enable companies, organizations and enterprises to collect data and rely on it. They use that data to understand their consumers’ behavior and habits in order to improve the marketing operations and decisions.
 Read more...
Big Data: Big Data Components
If we want to talk about Big Data, we have to talk about the elements it is composed of. We first have to collect data and then translated and stored. Then the final step is to analyze it so it is able to be presented in a comprehendible format. Read more...
Big Data: Applications of Big Data
There are uncountable ways in which Big Data is used. The whole importance of Big Data is based on the use of the data. It doesn’t matter how much a company or a business can collect data, but how much they can handle and use.
 Read more...
Big Data: Big Data Analytics
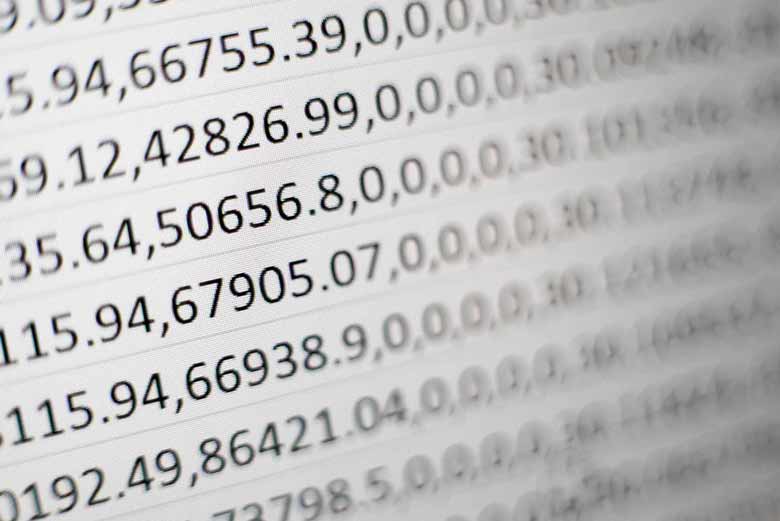
Analyzing the Big Data enables analysts and other researchers and developers to improve and get better at decision-making. It allows them to make those decisions fast and at a very large scale in real time. Those decisions are able to be made by using data that couldn’t and wasn’t able to be used or accessed before.
 Read more...
Big Data: Big Data Lake
Systems of record, systems of engagement, streaming data and other environments lead us to get powerful insights about what our visitors and users are doing. Not only that but to also understand the way our world is working around us.
 Read more...
Big Data: Dynamic Data
Dynamic data is an enormous part of Big Data. Dynamic data is also known as transactional data. Read more...
AI ML learning: Types of Artificial Intelligence
We can define Artificial Intelligence (AI) as a subset of computer science. Its main goal is to copy human behavior and intelligence in a machine or a device. That way they will be able to do tasks that generally can be only performed by humans.
 Read more...
AI ML learning: What is Artificial Intelligence
Artificial Intelligence has rapidly walked into our world. It revolutionized every aspect of daily life.
 Read more...
Data Visualization: The Data Visualization Market
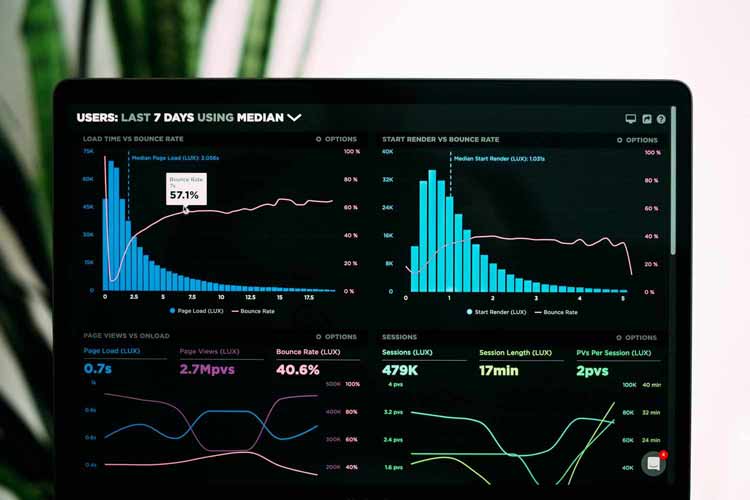
In the past decade, the amount of data generated by the IoT is enormous. Because of its large scale, data visualization aids to pin down the relationship between the multidimensional data sets. It issues empirical characteristics and features and elucidates them.
 Read more...
Data Visualization: Data Visualization Techniques
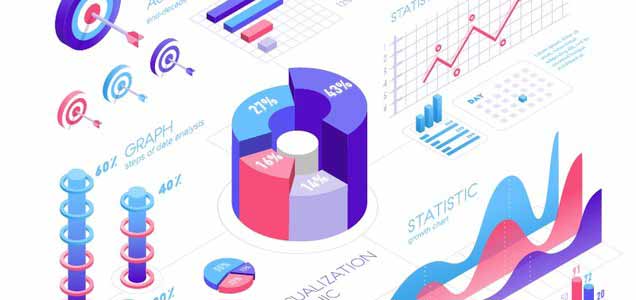
Data visualization is an essential component of an excellent business strategy.
 Read more...
Data Visualization: Data Visualization Terminology
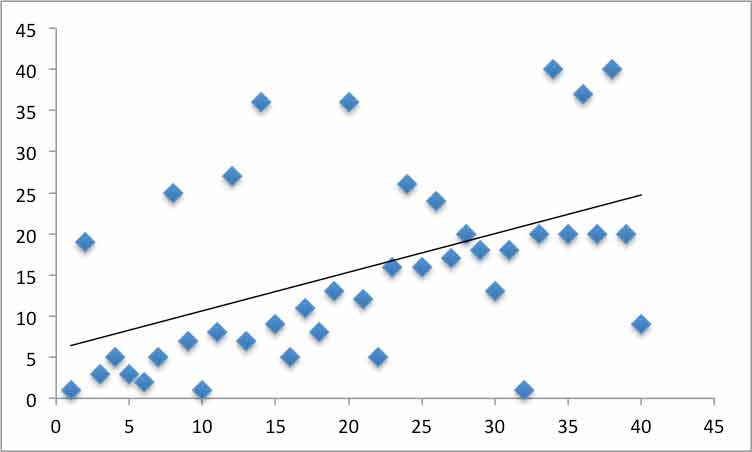
Data visualization is closely connected with statistics. That is why similar terms and terminology are involved and used. Data visualization derives from data science.
 Read more...
Data Visualization: Data visualization tools
To represent large data sets, designers use special data visualization tools. It is an easier way to deal with hundreds and thousands of data points. Read more...
Data Visualization: The Future of Data Visualization
It is a known fact that how data is visualized has evolved over the last ten years or so. Many companies, organizations and industries have sophisticated tools and softwares to present the enormous amounts of data they have been collecting.
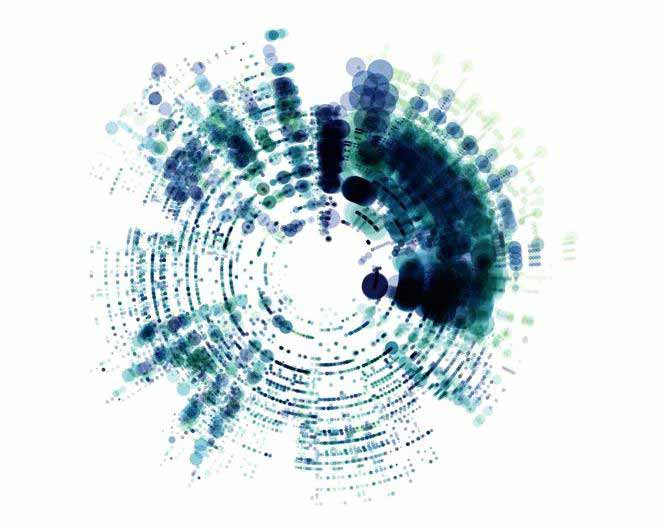 Read more...
Data Visualization: The history of data visualization
We think of data visualization as a relatively modern term. But graphically portraying information has its own history of origins and development.
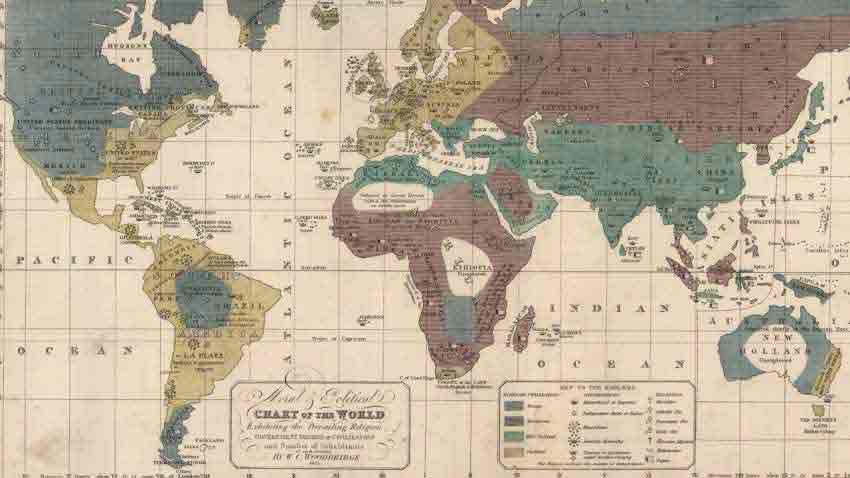 Read more...
Data Visualization: The science of data visualization
When we think of data visualization, we think of the process of presenting data in a simple, yet visually attractive way. To successfully show data, you have to create images that talk and communicate relationships between the data and the viewers. This can be achieved by using a systematic mapping.
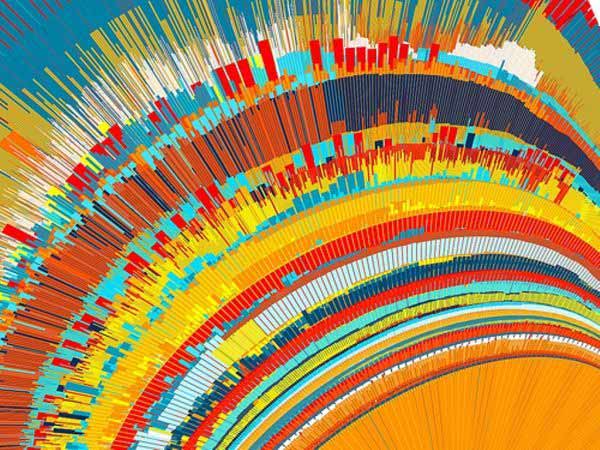 Read more...
Data Visualization: What is Data Visualization?
Data visualization is the technique to present data in a more visual and broad format. It enables business owners, stakeholders and decision-makers to visually analyze information. When they study the graphs, charts and bars, they identify new patterns and trends more easily
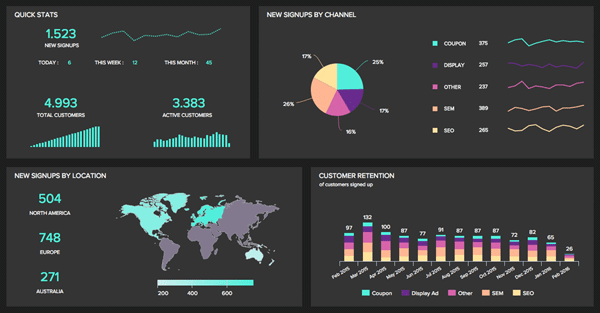 Read more...
Analytics: What is Google Analytics?
Anyone that wants to grow their website should use Google Analytics. This tool allows business owners to see how many visitors come to their page. It tells them where they come from and how much time they spend on your site
 Read more...
Analytics: Web Analytics Technologies
Web analytics is the process of measuring, collecting, analyzing, and reporting web data. This is purposefully made to drive and understand how a website is used. This doesn’t apply to increase web traffic. This process is crucial for web development and improved user experience.
Read more...
Analytics: Visual Analytics
The modern world is full of data. And to get through all of it, we have to use a navigator. We need to know where we should begin. This is where visual analytics comes into play.It guides us through the never-ending sea of data.
Read more...
Analytics: User Behavior Analytics
Many traditional tools don’t have the ability to detect irregularities in micro-actions. As technology improves, many hackers find other ways to steal identities, to compromise security, or even steal valuable information. And, many firewalls unfortunately aren’t able to prevent that anymore. Here is where UBA security comes into play.
 Read more...
Analytics: Data Analytics and Artificial Intelligence
Netflix uses artificial intelligence to offer you recommendations for products and services. But that wouldn't be possible without data analytics. The data you input from your device, account logins, likes, dislikes goes to data analytics servers.
Read more...
Analytics: Data Analytics Vs Data Analysis
Data analytics begins by defining a problem. And, then you create your hypotheses. To test the said hypotheses, you have to gather data. To clean that same data and then to analyze it.
Read more...
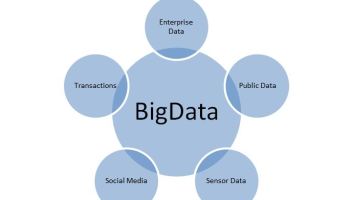
Big Data: What is Big Data?
Data plays an enormous role in today’s world. As technology has evolved, data has grown also. Unlike traditional data, big data comes from many sources and is often unorganized. But what is big data exactly?
 Read more...
Data: How is data collected and why is it so important?
Overall, data collection plays a massive role in one’s marketing strategy. Without data stores, businesses would drop almost in the dark using antiquated techniques to make their judgments. Alternatively, data accumulation enables them to linger on top of trends, present solutions to difficulties, plus examine novel insights to a significant result.
 Read more...
Data: Where does data come from?
Data is the main driving asset in data science. It plays an enormous role in how we use raw and complex information to expand our business.
Read more...
Data: What is data?
In our series about data we kick off with What is data?
Looking at 4 different kinds of data
Read more...
Analytics: Who will use it?
Collected data will need analytics to be performed on it and Will then use it?
Read more...
Visualization: Boxplots
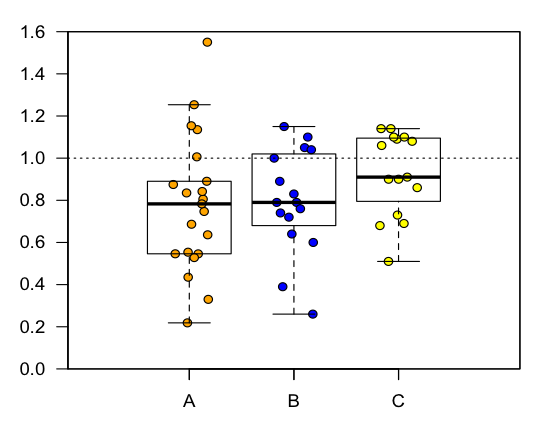
Finding outliers in a data set. What are outliers and how can we find them with a graph: Boxplots makes it easy to find each of them.
Visualization: 3Djs graphs for your application
This is a JavaScript library that have many different plots that you choose between.
Read more...
Visualization: Time series
Information is all around us and we collect almost all of it and store it as data.
With the old and newly created information/data we are able to do amazing things of in cable hands and minds!
