How is ANOVA used in Statistics
Analysis of Variance (ANOVA) is a statistical analysis technique that divides the observed aggregate variability within a data set into two components: systematic and random factors.
It is a widely used technique for assessing the likelihood that differences between means in sample data could be produced by chance. With ANOVA, what's different is the chance to evaluate a broader spectrum of measures than just two. We were still estimating two items in all of the t-test examples. For instance, we could ask if the difference could have been generated by chance between two sample means.
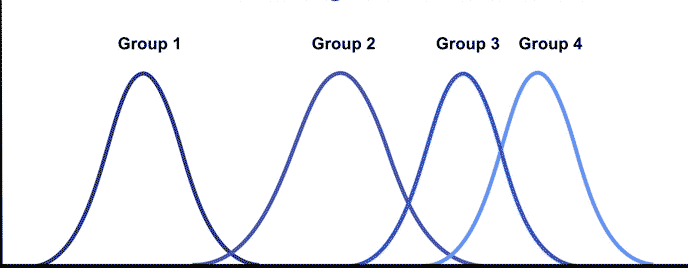
But, if there were more than two things in the experiment that we are comparing, then we would have to categorize them. We'd have a means of more than 2. For each category or condition, we will have an average. Depending on the experiment, it may be a significant amount. How are we able to compare all these methods?
For starters, we should run a plethora of t-tests. A t-test is a type of inferential statistic that is used to assess if there is a substantial distinction between the two means that can still be connected to individual characteristics. This means that we have to compare each combination of standards. The easier way of doing this is by using ANOVA.
In reality, we can use both ANOVA and t-tests to evaluate data with multiple means of data. Of course, this is possible only if the experiment has more than two conditions or groups. There are a lot of variations of the ANOVA test. These various types are for different research designs similar to the t-test.
One-Way ANOVA Versus Two-Way ANOVA
There are two types of ANOVA: one-way (or unidirectional) and two-way. One-way or two-way refers to the number of independent variables in your analysis of variance tests. A one-way ANOVA tests the effect on a single response variable of a sole factor. It decides if the tests are both the same. A one-way ANOVA is being used to evaluate if a mean of three or more distinct unrelated groups has any substantial statistical differences.
An addition to the one-way ANOVA is a two-way ANOVA. You have one independent variable with a one-way, which affects a dependent variable. There can be two separate entities with a two-way ANOVA.
For instance, a two-way ANOVA enables a business to compare productivity growth based on two independent variables, such as compensation and set of skills. It is used to analyze the correlation between the two variables and simultaneously measure two factors' influence.
ANOVA and the F-Ratio Test
The F-statistic is essentially a two-variance ratio. Variances are a measure of variability, or how much the information from the mean is scattered. Larger values express a more excellent dispersion.
The square of the standard deviation is the variance. For many of us, standard deviations are often much more comfortable to comprehend than variances. But this can be challenging as most studies conducted use variance to estimate.
In F-ratio statistics, the ratio of mean squares is based on this F-statistics. Mean square is a term that represents the degree of freedom (DF) is utilized to calculate the approximation. Simply, it is an estimate of some variance.
In simple words, F-statistics is the test statistics for any F-test. We can say that it is a ratio of two different quantities. These quantities, under the null hypothesis, are expected to be equal. This gives the F-statistics of 1, by estimation.
There are many ways in which you can use these F-tests. It is quite a versatile test. You can adjust the variables and variances used in the ratio and confidently use this test for any purpose.